

Mô tả
Big Data Charts là công nghệ data visualization hiệu năng cao thuộc nền tảng ChartDirector được phát triển bởi Advanced Software Engineering.
Giải pháp này được thiết kế để xử lý và hiển thị:
- Massive datasets
- Millions of data points
- High-frequency telemetry
- Enterprise analytics
- Realtime Big Data streams
- Large-scale visualization systems
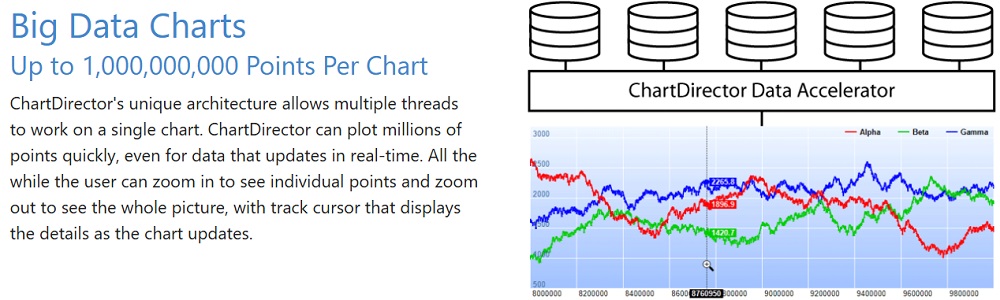
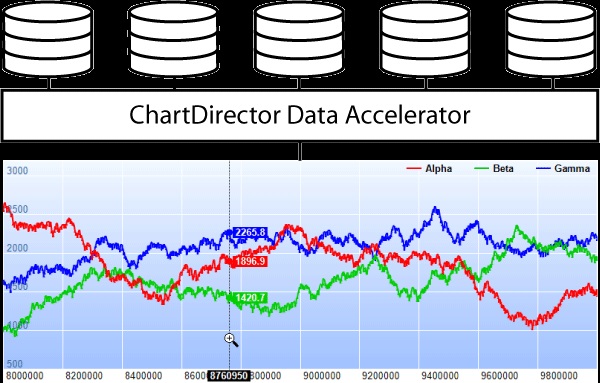
Theo khả năng được hãng công bố, ChartDirector có thể hỗ trợ visualization với số lượng dữ liệu cực lớn thông qua các công nghệ tối ưu rendering và data acceleration.
Big Data Charts đặc biệt phù hợp cho:
- Enterprise BI systems
- Financial analytics
- Scientific visualization
- IoT telemetry
- Infrastructure monitoring
- Industrial analytics
- AI và machine learning dashboards
Đây là một trong những điểm mạnh quan trọng giúp ChartDirector hoạt động hiệu quả trong các hệ thống analytics enterprise quy mô lớn.
Big Data Charts phù hợp với ai?
Giải pháp này phù hợp cho:
- BI Developers
- Data Engineers
- Data Scientists
- Enterprise Development Teams
- Financial Analytics Teams
- IoT Engineers
- SaaS Analytics Platforms
Đặc biệt phù hợp với doanh nghiệp:
- Xử lý datasets rất lớn
- Triển khai enterprise analytics platforms
- Xây dựng realtime monitoring systems
- Phân tích telemetry dữ liệu lớn
- Visualize machine learning data
- Theo dõi operational analytics quy mô lớn

Big Data Charts hoạt động như thế nào?
Big Data Charts hoạt động bằng cách:
- Tối ưu rendering engine
- Giảm tải visualization overhead
- Render dữ liệu theo viewport
- Tăng tốc chart drawing
- Tối ưu memory usage
- Sử dụng data acceleration techniques
Thay vì render toàn bộ dữ liệu cùng lúc, hệ thống có thể:
- Render dữ liệu theo vùng hiển thị
- Downsample datasets
- Stream dữ liệu theo thời gian thực
- Chỉ cập nhật phần thay đổi
Điều này giúp dashboard vẫn hoạt động mượt ngay cả với datasets rất lớn.
Tính năng nổi bật của Big Data Charts
Hỗ trợ Millions of Data Points
Một trong những điểm mạnh lớn nhất là khả năng xử lý dữ liệu quy mô lớn.
Hệ thống hỗ trợ:
- Millions of points
- High-frequency datasets
- Massive time-series analytics
- Streaming telemetry
- Large enterprise datasets
Điều này rất phù hợp cho:
- IoT systems
- Financial trading
- Scientific research
- Infrastructure analytics
High-performance Rendering Engine
ChartDirector được tối ưu cho:
- Fast rendering
- Realtime redraw
- Low-latency visualization
- High-speed chart generation
- Optimized graphics processing
Điều này giúp hệ thống hoạt động tốt trong enterprise environments có dữ liệu lớn.
Data Acceleration Technology
Big Data Charts hỗ trợ:
- Data acceleration
- Optimized rendering paths
- Efficient memory handling
- Incremental redraw
- Rendering optimization
Điều này giúp giảm tải CPU và memory khi xử lý visualization phức tạp.
Realtime Big Data Streaming
Hệ thống hỗ trợ:
- Streaming analytics
- Live telemetry
- Dynamic chart updates
- Realtime monitoring
- Continuous data feeds
Rất phù hợp cho:
- NOC dashboards
- SOC systems
- Smart factories
- Trading systems
- IoT platforms
Dynamic Downsampling
Một tính năng rất quan trọng là intelligent downsampling.
Hệ thống có thể:
- Giảm số lượng points hiển thị
- Giữ lại xu hướng dữ liệu
- Tăng tốc rendering
- Giảm memory usage
- Tối ưu user experience
Điều này giúp dashboard hiển thị mượt hơn mà vẫn đảm bảo khả năng phân tích dữ liệu.
Scalable Time-Series Visualization
Big Data Charts đặc biệt mạnh với:
- Time-series analytics
- Historical datasets
- Long-term telemetry
- Continuous monitoring data
- High-frequency event streams
Ví dụ:
- Stock market analytics
- Sensor telemetry
- Network monitoring
- Cloud infrastructure analytics
Multi-threaded Processing
ChartDirector hỗ trợ:
- Multi-core rendering
- Parallel processing
- Concurrent visualization
- Background chart generation
Điều này giúp tăng hiệu năng đáng kể trong enterprise analytics systems.
Realtime Scrolling và Navigation
Big Data Charts hỗ trợ:
- Zoom datasets lớn
- Scroll realtime
- Dynamic viewport management
- Interactive navigation
- Track cursor interaction
Người dùng có thể phân tích datasets lớn trực quan hơn.
Financial Big Data Analytics
Một trong những ứng dụng mạnh nhất là financial visualization.
Hệ thống hỗ trợ:
- High-frequency trading charts
- Market telemetry
- Technical indicators
- Financial time-series analytics
- Realtime market dashboards
Điều này rất phù hợp cho:
- Trading platforms
- Banking systems
- Investment analytics
- Market intelligence dashboards
IoT và Telemetry Visualization
Big Data Charts hỗ trợ:
- Sensor data analytics
- Smart factory dashboards
- Edge computing analytics
- Device telemetry
- Environmental monitoring
Ví dụ:
- Temperature sensors
- Power systems
- Manufacturing telemetry
- Industrial analytics
Layered Architecture Integration
Big Data Charts hoạt động cùng Layered Architecture.
Developers có thể:
- Overlay nhiều datasets lớn
- Combine realtime analytics
- Add annotations
- Synchronize charts
- Build enterprise dashboards
Điều này giúp visualization chuyên nghiệp và linh hoạt hơn.
Interactive Big Data Analytics
Hệ thống hỗ trợ:
- Interactive zoom
- Scroll datasets lớn
- Realtime cursor tracking
- Dynamic tooltips
- Multi-chart synchronization
Điều này giúp người dùng phân tích Big Data hiệu quả hơn.
Enterprise Dashboard Support
Big Data Charts phù hợp để xây dựng:
- Executive dashboards
- Operational analytics
- KPI systems
- Realtime monitoring
- Infrastructure analytics
Dashboard có thể hoạt động ổn định ngay cả với lượng dữ liệu rất lớn.
Hỗ trợ nhiều loại biểu đồ Big Data
Big Data Charts hỗ trợ:
- Line Charts
- Scatter Charts
- Area Charts
- Financial Charts
- Heat Maps
- Realtime Charts
- Multi-axis Charts
- Combo Charts
Điều này giúp developers linh hoạt khi xây dựng analytics platforms.
Các ứng dụng phổ biến của Big Data Charts
Lợi ích khi sử dụng Big Data Charts
Visualize datasets lớn hiệu quả hơn
Người dùng có thể:
- Phân tích dữ liệu lớn realtime
- Theo dõi telemetry trực quan
- Xem historical analytics
- Tương tác với datasets lớn dễ dàng hơn
Tối ưu enterprise analytics systems
Rất phù hợp cho:
- Enterprise BI
- NOC dashboards
- SOC systems
- Operational monitoring
Hỗ trợ realtime Big Data analytics
Có thể triển khai cho:
- Streaming telemetry
- IoT platforms
- Trading systems
- Cloud monitoring
Giảm tải visualization infrastructure
Không cần:
- Tự xây rendering engine
- Viết Big Data chart framework riêng
- Tối ưu visualization pipeline từ đầu
Yêu cầu hệ thống
Big Data Charts hoạt động trong nền tảng ChartDirector hỗ trợ:
- Windows
- Linux
- macOS
Ngôn ngữ hỗ trợ:
- .NET
- Java
- Python
- PHP
- C++
- Perl
Yêu cầu khuyến nghị:
- CPU đa nhân
- RAM từ 8GB–32GB tùy workload
- SSD cho datasets lớn
- GPU khuyến nghị cho realtime analytics
- Network ổn định cho streaming systems
Hướng dẫn cài đặt Big Data Charts
Bước 1: Cài đặt ChartDirector
Tải và cài đặt thư viện ChartDirector tương ứng với môi trường phát triển.
Bước 2: Import thư viện
Ví dụ với .NET:
using ChartDirector;Ví dụ với Python:
import pychartdirBước 3: Tạo Big Data chart
Ví dụ:
XYChart c = new XYChart(1000, 600);Bước 4: Kết nối nguồn dữ liệu lớn
Có thể lấy dữ liệu từ:
- Databases
- Data lakes
- Streaming systems
- Sensors
- APIs
- Message queues
Bước 5: Build analytics dashboard
Có thể triển khai:
- Enterprise BI
- Monitoring systems
- Financial analytics
- Telemetry platforms
Cách triển khai Big Data Charts trong thực tế
Enterprise BI Systems
Phù hợp cho:
- KPI dashboards
- Executive analytics
- Operational reporting
- Business intelligence platforms
Financial Systems
Có thể dùng để:
- Trading dashboards
- Market analytics
- Investment monitoring
- Risk analysis systems
IoT và Industrial Analytics
Hỗ trợ:
- Smart factory monitoring
- Sensor analytics
- SCADA systems
- Industrial telemetry
Cloud và Infrastructure Monitoring
Phù hợp với:
- Server analytics
- Cloud monitoring
- DevOps dashboards
- Infrastructure telemetry
Scientific Applications
Có thể triển khai cho:
- Research analytics
- Simulation visualization
- Statistical systems
- Engineering telemetry
Những điểm cần lưu ý
- Datasets cực lớn cần chiến lược downsampling và viewport rendering hợp lý
- Dashboard realtime Big Data cần tối ưu refresh rate để tránh overload hệ thống
- Visualization quá nhiều datasets cùng lúc có thể ảnh hưởng readability nếu thiết kế không hợp lý
Tuy nhiên, nhiều developers đánh giá cao Big Data Charts nhờ:
- Hiệu năng rendering mạnh
- Big Data support tốt
- Streaming analytics hiệu quả
- Enterprise scalability cao
- Visualization quality chuyên nghiệp
Kết luận
Big Data Charts là giải pháp visualization dữ liệu lớn mạnh mẽ trong nền tảng ChartDirector, giúp doanh nghiệp xây dựng các analytics systems, monitoring platforms và enterprise dashboards với khả năng xử lý massive datasets chuyên nghiệp.
Được phát triển bởi Advanced Software Engineering, công nghệ này giúp:
- Visualize Big Data hiệu quả
- Xây dựng realtime analytics dashboards
- Hỗ trợ telemetry systems quy mô lớn
- Triển khai enterprise monitoring platforms
- Tối ưu high-performance data visualization
Nếu doanh nghiệp của bạn đang cần một giải pháp Big Data visualization mạnh mẽ cho dashboard và analytics systems, Big Data Charts của ChartDirector là một lựa chọn rất đáng cân nhắc hiện nay.
Ghi chú: Giá tham khảo cho số lượng 1 và thay đổi theo tỷ giá và số lượng. Quý khách vui lòng liên hệ Tri Thức để có giá chính xác vào thời điểm mua hàng.

Đánh giá
Chưa có đánh giá nào.