

Mô tả
Real-Time Charts là công nghệ realtime charting thuộc nền tảng ChartDirector được phát triển bởi Advanced Software Engineering.
Giải pháp này cho phép developers xây dựng các biểu đồ realtime với khả năng:
- Hiển thị dữ liệu trực tiếp
- Streaming analytics
- Dynamic chart updates
- Live monitoring
- High-frequency visualization
- Realtime dashboards
- Continuous data rendering
Real-Time Charts đặc biệt phù hợp cho:
- IoT systems
- SCADA dashboards
- Trading platforms
- Network monitoring
- Industrial analytics
- Enterprise monitoring systems
- Realtime telemetry applications
Đây là một trong những tính năng mạnh nhất của ChartDirector dành cho realtime analytics và operational dashboards.
Real-Time Charts phù hợp với ai?
Giải pháp này phù hợp cho:
- Dashboard Developers
- IoT Engineers
- DevOps Teams
- BI Developers
- Financial Software Teams
- Industrial Monitoring Teams
- SaaS Analytics Platforms
Đặc biệt phù hợp với doanh nghiệp:
- Cần realtime monitoring systems
- Muốn xây dựng live dashboards
- Triển khai telemetry analytics
- Xây dựng NOC/SOC systems
- Theo dõi sensor data realtime
- Visualize streaming analytics

Real-Time Charts hoạt động như thế nào?
Real-Time Charts hoạt động bằng cách:
- Nhận dữ liệu realtime liên tục
- Update chart động
- Render dữ liệu mới ngay lập tức
- Scroll timeline tự động
- Refresh visualization theo chu kỳ
- Tối ưu performance cho dữ liệu streaming
Khi dữ liệu mới được gửi tới:
- Chart sẽ update ngay lập tức
- Các axes tự động scale lại
- Dữ liệu cũ có thể tự động archive hoặc scroll
- Dashboard hiển thị trạng thái mới nhất realtime
Điều này giúp doanh nghiệp theo dõi hệ thống liên tục mà không cần reload toàn bộ dashboard.
Tính năng nổi bật của Real-Time Charts
Live Data Streaming
Một trong những tính năng quan trọng nhất là streaming visualization.
Hệ thống hỗ trợ:
- Continuous data feeds
- Streaming analytics
- Realtime telemetry
- Dynamic chart updates
- High-frequency data visualization
Điều này rất phù hợp cho:
- IoT systems
- Financial trading
- Infrastructure monitoring
- Industrial telemetry
Developers có thể visualize dữ liệu ngay khi dữ liệu phát sinh.
Dynamic Chart Updates
Real-Time Charts hỗ trợ:
- Incremental updates
- Partial redraw
- Dynamic rendering
- Live chart refresh
- Smooth realtime animation
Điều này giúp dashboard hoạt động mượt mà hơn thay vì render lại toàn bộ chart.
Scrolling Time-Series Charts
Một trong những tính năng nổi bật là realtime scrolling charts.
Hệ thống hỗ trợ:
- Auto-scrolling timeline
- Moving time windows
- Continuous data flow
- Historical data tracking
- Dynamic viewport management
Điều này đặc biệt hữu ích cho:
- Sensor monitoring
- Stock analytics
- Network telemetry
- Realtime logs
High-frequency Rendering
ChartDirector được tối ưu cho:
- High-speed rendering
- Low-latency updates
- Large streaming datasets
- High-frequency telemetry
- Realtime refresh performance
Điều này giúp hệ thống hoạt động tốt trong enterprise realtime environments.
Millions of Data Points Support
Real-Time Charts hỗ trợ:
- Large datasets
- Millions of points
- Data acceleration
- Optimized rendering
- Big Data visualization
Điều này rất phù hợp cho:
- Enterprise analytics
- Industrial monitoring
- Scientific telemetry
- Financial systems
Realtime KPI Dashboards
Real-Time Charts có thể dùng để xây dựng:
- KPI dashboards
- Executive scorecards
- Operational monitoring
- Infrastructure analytics
- Live reporting systems
Dashboard có thể cập nhật realtime mà không cần reload trang.
Realtime Financial Analytics
Một trong những ứng dụng mạnh nhất là financial visualization.
Hệ thống hỗ trợ:
- Live stock charts
- Candlestick realtime updates
- OHLC streaming
- Technical indicators realtime
- Trading dashboards
Điều này rất phù hợp cho:
- Trading platforms
- Banking systems
- Investment analytics
- Market monitoring
Realtime IoT Visualization
Real-Time Charts hỗ trợ:
- Sensor analytics
- Telemetry dashboards
- Smart factory monitoring
- Device analytics
- Edge computing visualization
Ví dụ:
- Temperature sensors
- Power monitoring
- Environmental analytics
- Industrial telemetry
Layered Architecture Integration
Real-Time Charts hoạt động cùng Layered Architecture.
Developers có thể:
- Overlay nhiều realtime datasets
- Add annotations động
- Combine indicators
- Synchronize charts
- Build advanced dashboards
Điều này giúp visualization chuyên nghiệp hơn.

Interactive Realtime Navigation
Hệ thống hỗ trợ:
- Zoom realtime
- Scroll realtime
- Track cursor interaction
- Dynamic tooltips
- Multi-chart synchronization
Người dùng có thể tương tác trực tiếp với realtime data.
Realtime Alert Visualization
Real-Time Charts hỗ trợ:
- Threshold monitoring
- Alert zones
- Dynamic warnings
- Critical indicators
- Event highlighting
Điều này rất hữu ích cho:
- SOC systems
- NOC monitoring
- Manufacturing dashboards
- Industrial control systems
Multi-threaded Rendering
ChartDirector tối ưu cho:
- Multi-core systems
- Parallel rendering
- Realtime processing
- High-performance dashboards
Điều này giúp hệ thống ổn định hơn khi xử lý dữ liệu lớn realtime.
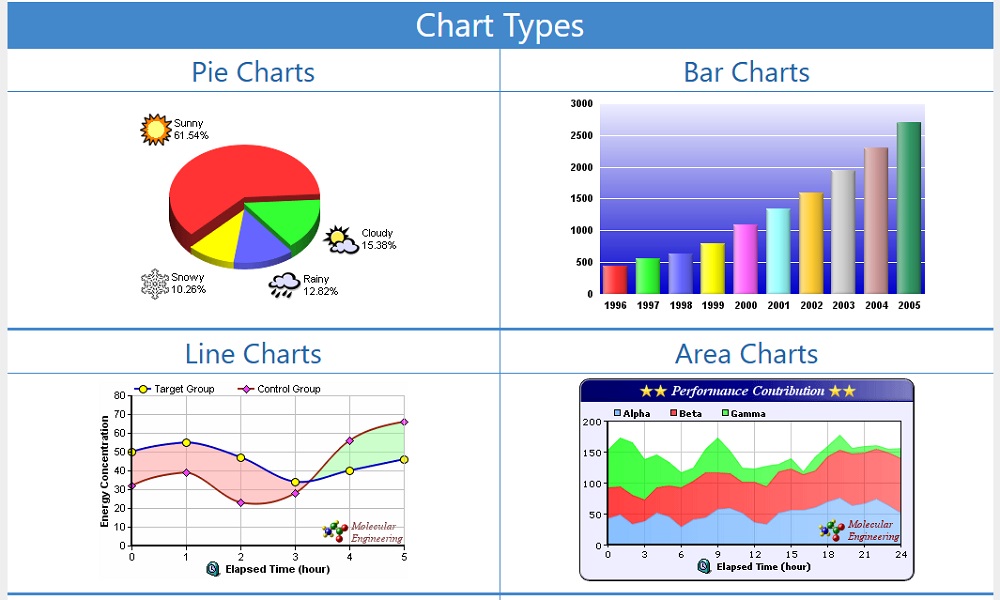
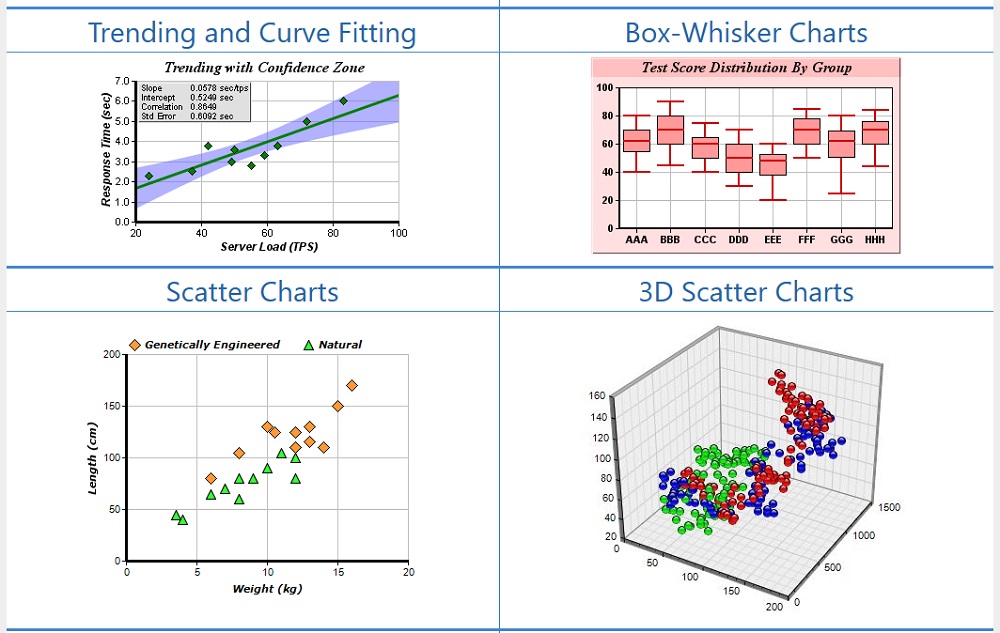
Hỗ trợ nhiều loại biểu đồ realtime
Real-Time Charts hỗ trợ:
- Line Charts
- Spline Charts
- Area Charts
- Scatter Charts
- Financial Charts
- Gauge Charts
- Multi-axis Charts
- Combo Charts
Điều này giúp developers linh hoạt hơn khi xây dựng dashboards.
Các ứng dụng phổ biến của Real-Time Charts
Tăng khả năng realtime monitoring
Người dùng có thể:
- Theo dõi dữ liệu trực tiếp
- Phát hiện sự cố nhanh hơn
- Phân tích realtime analytics
- Quan sát hệ thống liên tục
Tối ưu enterprise dashboards
Rất phù hợp cho:
- NOC dashboards
- SOC systems
- KPI monitoring
- Operational analytics
Hỗ trợ Big Data và telemetry systems
Có thể triển khai cho:
- Millions of sensor events
- Streaming telemetry
- High-frequency analytics
- Realtime infrastructure monitoring
Giảm thời gian phát triển realtime systems
Không cần:
- Tự xây realtime rendering engine
- Viết custom streaming framework
- Tạo dashboard refresh logic từ đầu
Yêu cầu hệ thống
Real-Time Charts hoạt động trong nền tảng ChartDirector hỗ trợ:
- Windows
- Linux
- macOS
Ngôn ngữ hỗ trợ:
- .NET
- Java
- Python
- PHP
- C++
- Perl
Yêu cầu khuyến nghị:
- CPU đa nhân
- RAM từ 8GB trở lên
- SSD cho telemetry systems lớn
- GPU khuyến nghị cho realtime dashboards phức tạp
- Network ổn định cho streaming analytics
Hướng dẫn cài đặt Real-Time Charts
Bước 1: Cài đặt ChartDirector
Tải và cài đặt thư viện ChartDirector tương ứng với platform sử dụng.
Bước 2: Import thư viện
Ví dụ với .NET:
using ChartDirector;Ví dụ với Python:
import pychartdirBước 3: Tạo realtime chart
Ví dụ:
XYChart c = new XYChart(800, 600);Bước 4: Kết nối nguồn dữ liệu realtime
Có thể lấy dữ liệu từ:
- Sensors
- APIs
- Message queues
- Databases
- Streaming platforms
Bước 5: Build realtime dashboard
Có thể triển khai:
- Monitoring systems
- Trading platforms
- Telemetry dashboards
- Enterprise analytics
Cách triển khai Real-Time Charts trong thực tế
IoT và Industrial Systems
Phù hợp cho:
- Smart factories
- Sensor analytics
- SCADA systems
- Industrial telemetry
Financial Systems
Có thể dùng để:
- Trading dashboards
- Stock analytics
- Investment monitoring
- Market data visualization
Enterprise Monitoring
Hỗ trợ:
- Infrastructure monitoring
- NOC dashboards
- SOC systems
- Cloud analytics
SaaS Analytics Platforms
Phù hợp với:
- Customer analytics
- Usage telemetry
- Platform monitoring
- Live KPI dashboards
Scientific Applications
Có thể triển khai cho:
- Research telemetry
- Simulation analytics
- Engineering monitoring
- Statistical visualization
Những điểm cần lưu ý
- Dashboard realtime lớn cần tối ưu refresh rate và rendering strategy
- Streaming datasets quá lớn cần cơ chế archive hoặc rolling window
- Quá nhiều realtime charts trên cùng dashboard có thể ảnh hưởng performance nếu không tối ưu đúng cách
Tuy nhiên, nhiều developers đánh giá cao Real-Time Charts nhờ:
- Realtime rendering mạnh
- Big Data support tốt
- Streaming analytics hiệu quả
- Enterprise scalability cao
- Dashboard quality chuyên nghiệp
Kết luận
Real-Time Charts là giải pháp realtime visualization mạnh mẽ trong nền tảng ChartDirector, giúp doanh nghiệp xây dựng các monitoring systems, analytics platforms và dashboards với khả năng hiển thị dữ liệu realtime chuyên nghiệp.
Được phát triển bởi Advanced Software Engineering, công nghệ này giúp:
- Visualize dữ liệu realtime hiệu quả
- Xây dựng live dashboards chuyên nghiệp
- Hỗ trợ telemetry analytics quy mô lớn
- Triển khai enterprise monitoring systems
- Tối ưu Big Data realtime visualization
Nếu doanh nghiệp của bạn đang cần một giải pháp realtime charting mạnh mẽ cho dashboard và analytics systems, Real-Time Charts của ChartDirector là một lựa chọn rất đáng cân nhắc hiện nay.
Ghi chú: Giá tham khảo cho số lượng 1 và thay đổi theo tỷ giá và số lượng. Quý khách vui lòng liên hệ Tri Thức để có giá chính xác vào thời điểm mua hàng.

Đánh giá
Chưa có đánh giá nào.