

Mô tả
Layered Architecture là một trong những công nghệ cốt lõi của nền tảng ChartDirector được phát triển bởi Advanced Software Engineering.
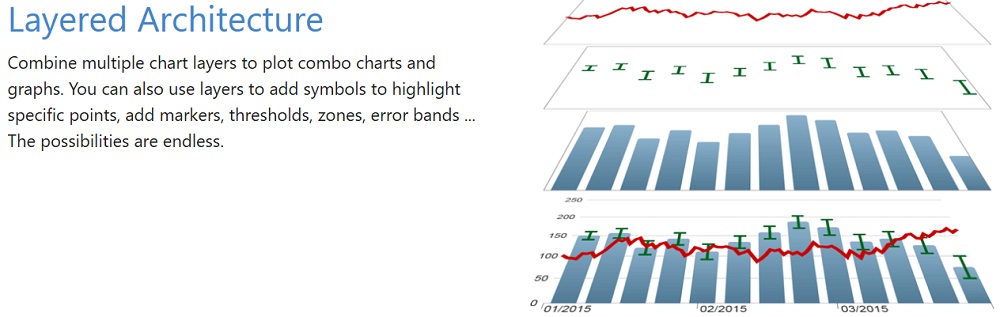
Kiến trúc này cho phép developers xây dựng các biểu đồ phức tạp bằng cách kết hợp nhiều lớp (layers) dữ liệu, visualization và hiệu ứng trên cùng một chart.
Theo thông tin chính thức từ hãng, Layered Architecture giúp developers:
- Kết hợp nhiều loại biểu đồ
- Overlay dữ liệu
- Tạo combo charts
- Thêm annotations
- Tùy biến visualization chuyên sâu
- Xây dựng dashboard enterprise-level
Đây là một trong những điểm mạnh lớn giúp ChartDirector khác biệt so với nhiều chart libraries thông thường.
Layered Architecture phù hợp với ai?
Công nghệ này phù hợp cho:
- BI Developers
- Financial Software Developers
- Data Analysts
- Enterprise Development Teams
- Scientific Visualization Teams
- SaaS Analytics Platforms
- IoT Dashboard Developers
Đặc biệt phù hợp với doanh nghiệp:
- Muốn tạo dashboard phức tạp
- Xây dựng biểu đồ tài chính chuyên sâu
- Triển khai realtime monitoring systems
- Tạo enterprise reporting platforms
- Visualize nhiều datasets trên cùng chart

Layered Architecture hoạt động như thế nào?
Trong ChartDirector, mỗi biểu đồ được xây dựng từ nhiều layers khác nhau.
Ví dụ:
- Background Layer
- Plot Area Layer
- Data Layer
- Annotation Layer
- Trend Line Layer
- Label Layer
- Marker Layer
Mỗi layer có thể hoạt động độc lập và được customize riêng.
Điều này cho phép developers:
- Overlay nhiều datasets
- Kết hợp nhiều chart types
- Tạo hiệu ứng visualization nâng cao
- Build enterprise dashboards chuyên nghiệp
Tính năng nổi bật của Layered Architecture
Kết hợp nhiều loại biểu đồ trên cùng một chart
Đây là tính năng nổi bật nhất.
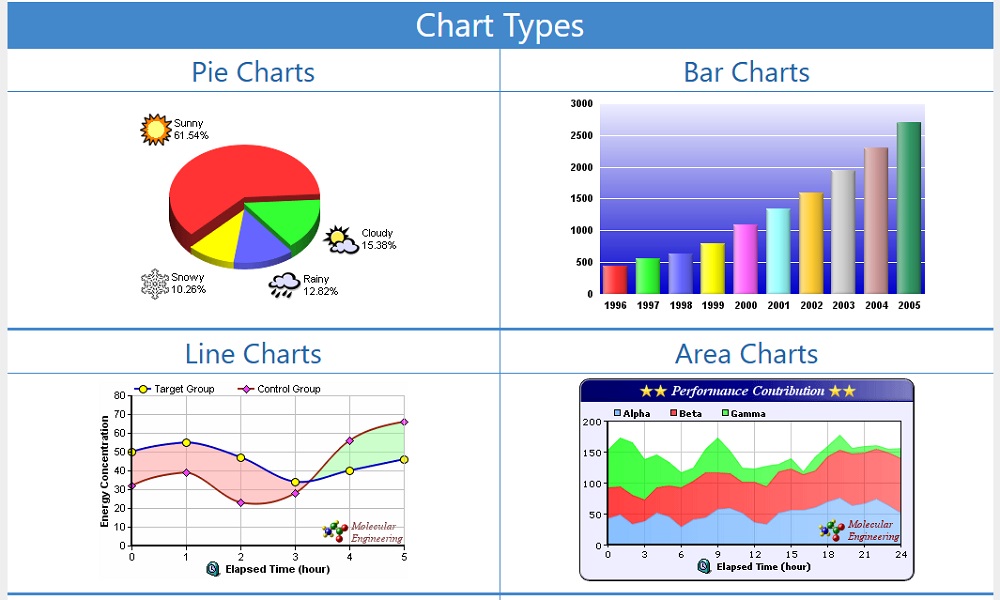
Layered Architecture cho phép:
- Bar + Line Charts
- Area + Spline Charts
- Scatter + Trend Lines
- Candlestick + Volume Charts
- Heat Map + Labels
- Multi-axis Combo Charts
Điều này rất hữu ích cho:
- Financial dashboards
- KPI systems
- Scientific analytics
- Enterprise BI reports
Overlay nhiều datasets
Layered Architecture hỗ trợ:
- Overlay data series
- Multiple scales
- Multiple axes
- Independent rendering
- Data synchronization
Điều này giúp biểu diễn dữ liệu phức tạp trực quan hơn.
Ví dụ:
- So sánh doanh thu và lợi nhuận
- Hiển thị stock price + trading volume
- Visualize sensor data đa tầng
Multi-axis Support
ChartDirector hỗ trợ:
- Multiple X axes
- Multiple Y axes
- Secondary axes
- Independent scaling
- Axis synchronization
Điều này rất hữu ích cho:
- Financial analytics
- Industrial monitoring
- Scientific visualization
- Engineering dashboards
Annotation và Marker Layers
Layered Architecture hỗ trợ:
- Custom labels
- Annotations
- Markers
- Highlight regions
- Threshold indicators
- Alert zones
Ví dụ:
- Highlight vùng bất thường
- Đánh dấu KPI quan trọng
- Hiển thị event timeline
- Gắn cảnh báo trực tiếp trên chart
Trend Lines và Technical Indicators
Một trong những ứng dụng mạnh nhất là financial charting.
Layered Architecture hỗ trợ:
- Trend lines
- Moving averages
- Bollinger Bands
- RSI indicators
- MACD
- Technical overlays
Independent Layer Styling
Mỗi layer có thể được customize riêng:
- Colors
- Transparency
- Shadows
- Gradients
- Fonts
- Borders
- Rendering styles
Realtime Layer Updates
Layered Architecture hỗ trợ:
- Dynamic layer updates
- Realtime rendering
- Streaming data visualization
- Partial redraw optimization
Điều này giúp tối ưu hiệu năng cho:
- Realtime dashboards
- IoT systems
- Trading platforms
- Industrial monitoring
High-performance Rendering
Theo hãng, Layered Architecture được tối ưu cho:
- Millions of data points
- Multi-thread rendering
- Data acceleration
- Large datasets
- High-speed chart generation
Flexible Object-oriented API
Layered Architecture sử dụng API hướng đối tượng mạnh mẽ.
Developers có thể:
- Add layers dynamically
- Remove layers
- Update layers independently
- Customize rendering logic
- Reuse visualization components
Ví dụ:
XYChart c = new XYChart(600, 400);

LineLayer layer = c.addLineLayer(data);
Điều này giúp xây dựng visualization systems linh hoạt hơn.
Hỗ trợ Interactive Charts
Layered Architecture hỗ trợ:
- Interactive cursors
- Tooltips
- Drill-down charts
- Clickable regions
- Dynamic legends
- Mouse events
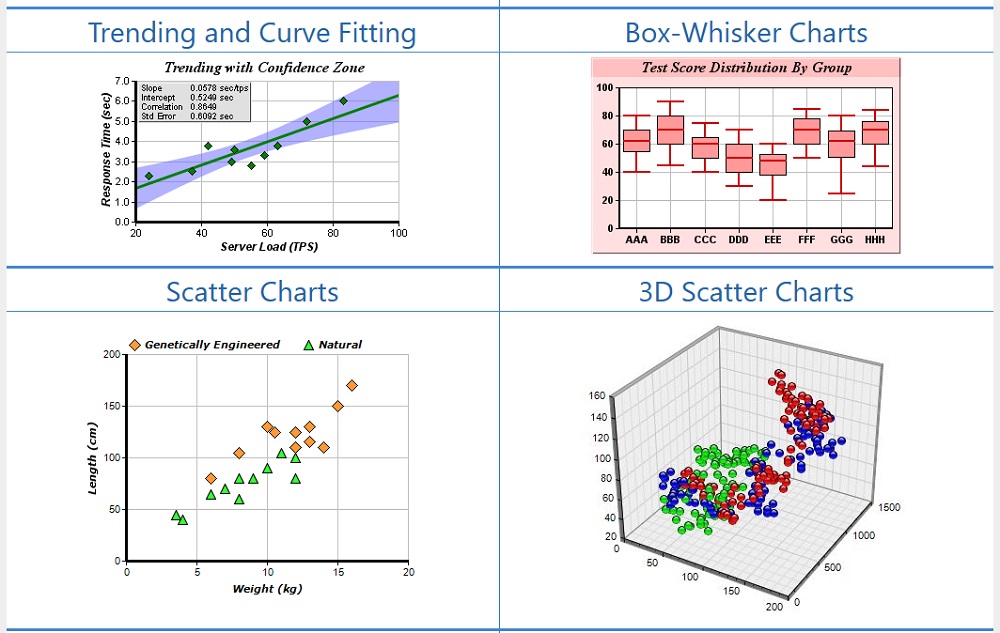
Hỗ trợ 2D và 3D Visualization
Layered Architecture hoạt động với:
- 2D charts
- 3D charts
- Surface charts
- Contour charts
- Scientific visualization
Điều này giúp developers xây dựng visualization chuyên sâu hơn.
Ví dụ mô hình Layered Architecture
Một chart phức tạp có thể được xây dựng từ nhiều lớp dữ liệu và visualization khác nhau.
Lợi ích khi sử dụng Layered Architecture
Tạo dashboard chuyên nghiệp hơn
Developer có thể:
- Build combo charts phức tạp
- Overlay nhiều datasets
- Tạo enterprise dashboards
- Visualize dữ liệu chuyên sâu
Visualization linh hoạt hơn
Layered Architecture cho phép:
- Customize từng layer riêng
- Reuse chart components
- Tạo visualization động
- Thiết kế dashboard theo branding doanh nghiệp
Tăng hiệu năng realtime systems
Rất phù hợp cho:
- IoT dashboards
- Trading platforms
- Monitoring systems
- Enterprise analytics
Giảm thời gian phát triển visualization
Không cần:
- Tự xây rendering engine
- Viết custom overlay logic
- Xây visualization framework riêng
Yêu cầu hệ thống
Layered Architecture hoạt động trong nền tảng ChartDirector hỗ trợ:
- Windows
- Linux
- macOS
Ngôn ngữ hỗ trợ:
- .NET
- Java
- C++
- Python
- PHP
- Perl
Yêu cầu:
- Runtime phù hợp với từng platform
- RAM từ 4GB–8GB trở lên
- GPU khuyến nghị cho realtime dashboards lớn
Hướng dẫn triển khai Layered Architecture
Bước 1: Cài đặt ChartDirector
Tải ChartDirector từ website chính thức của Advanced Software Engineering.
Bước 2: Khởi tạo chart
Ví dụ:
XYChart c = new XYChart(800, 600);Bước 3: Thêm các layers
Ví dụ:
c.addBarLayer(data0);
c.addLineLayer(data1);
Bước 4: Customize từng layer
Có thể cấu hình:
- Colors
- Labels
- Axes
- Rendering styles
- Markers
- Trend lines
Bước 5: Render dashboard
Developer có thể build:
- Financial dashboards
- BI systems
- Monitoring platforms
- Scientific visualization systems
Cách triển khai Layered Architecture trong thực tế
Financial Applications
Phù hợp cho:
- Stock charts
- Technical analysis
- Trading dashboards
- Investment systems
Enterprise BI Systems
Có thể dùng để:
- KPI dashboards
- Executive analytics
- Operational monitoring
- Business reporting
IoT và Industrial Systems
Hỗ trợ:
- Sensor visualization
- SCADA dashboards
- Manufacturing analytics
- Realtime monitoring
Scientific Applications
Phù hợp với:
- Research visualization
- Engineering systems
- Simulation dashboards
- Statistical analysis
SaaS Analytics Platforms
Có thể triển khai cho:
- Cloud dashboards
- Realtime analytics
- Data visualization platforms
- Reporting systems
Những điểm cần lưu ý
- Layered Architecture phù hợp hơn với enterprise visualization phức tạp thay vì chart đơn giản
- Dashboard realtime lớn cần tối ưu rendering và memory usage
- Learning curve có thể cao hơn chart libraries cơ bản do kiến trúc rất linh hoạt
Tuy nhiên, nhiều developers đánh giá cao Layered Architecture nhờ:
- Visualization flexibility rất mạnh
- Realtime performance tốt
- Financial charting chuyên sâu
- Overlay capabilities mạnh
- Enterprise scalability cao
Kết luận
Layered Architecture là một trong những công nghệ cốt lõi mạnh mẽ nhất của ChartDirector, giúp developers xây dựng các hệ thống visualization, dashboard và analytics chuyên nghiệp với khả năng tùy biến cực cao.
Được phát triển bởi Advanced Software Engineering, công nghệ này giúp:
- Kết hợp nhiều chart types trên cùng dashboard
- Overlay datasets linh hoạt
- Tạo realtime analytics systems
- Xây dựng enterprise BI platforms
- Tối ưu visualization hiệu năng cao
Nếu doanh nghiệp của bạn đang cần một kiến trúc visualization mạnh mẽ cho các hệ thống dashboard và analytics phức tạp, Layered Architecture của ChartDirector là một lựa chọn rất đáng cân nhắc hiện nay.
Ghi chú: Giá tham khảo cho số lượng 1 và thay đổi theo tỷ giá và số lượng. Quý khách vui lòng liên hệ Tri Thức để có giá chính xác vào thời điểm mua hàng.

Đánh giá
Chưa có đánh giá nào.